The Line Blender: Embedding Line Performance Using a GNN
2026-01-31
...ideally, lineups are more than just the sum of their parts. Players interact in ways that can amplify or diminish their individual contributions. The challenge is that there is limited icetime available to test every possible combination against real competition.
Finding optimal combinations is, as it sounds, a combinatorial problem. A roster of 13 forwards and 7 defensemen, can yield 286 unique forward lines and 21 unique defensive pairings. If a coach wanted to see just 20 minutes of play from every forward combination, it would take approximately 95 games of icetime to cycle through them all.
To solve this, we can extrapolate from existing data to infer how unseen combinations would perform. By encoding players and their historical relationships into a Graph Neural Network (GNN), we can embed player information as "nodes" and their shared icetime as "edges". This allows the model to predict the expected goals percentage (xG%) for lines that may have never played a single shift together.
To train the GNN, I used MoneyPuck's skater data (2008-2025; 17,306 player seasons) and line/pairing data (136,782 forward lines, and 20,676 defensive pairings)[^1^2].
One important thing to keep in mind when working with xG% and other performance measures is variance. In small samples, where lines or pairings have low icetime, results can swing wildly.
As mentioned in the first post, xG% metrics are susceptible to variance in small samples (i.e., low icetime). To address this, I utilized a weighted mean squared error (MSE) loss function, where the loss is weighted by the logarithm of the line's icetime. This emphasizes lines and pairings with higher icetime, where performance metrics are more likely to approximate their "true" values.
Using the GNN, we can produce all possible combinations of lines and pairings, score them, and optimize the combinations using greedy and LP optimization. We can now evaluate all possible combinations of players on the Oiler's roster with at least 20 minutes of icetime in 2025 for the Oilers3:
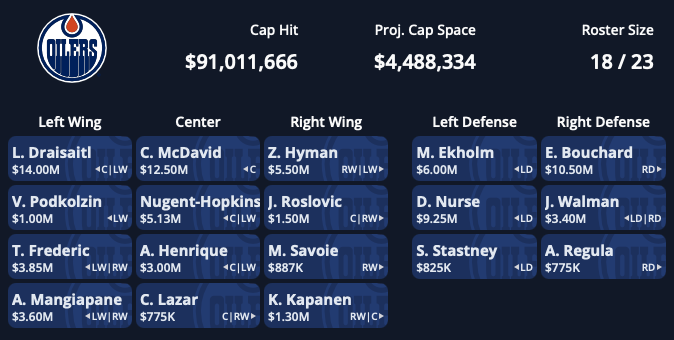
Defense: Ekholm, Bouchard (64% xG%); Nurse, Walman (58% xG%); Stastney, Regula (49% xG%)
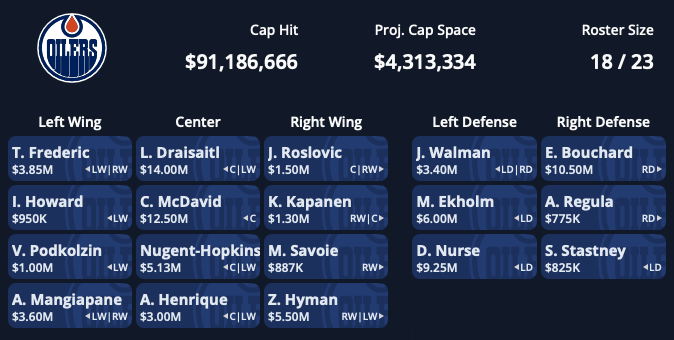
Defense: Walman, Bouchard (59% xG%); Ekholm, Regula (58% xG%); Nurse, Stastney (57% xG%)
By using the GNN, we can evaluate any hypothetical lineup. Including combinations across teams, where little to no historical line data may exist.
In my next post, we’ll take the GNN to the international stage to evaluate Olympic rosters based on player performance in the NHL.
All posts in this series:
1. The Line Blender: Optimizing Lineups Using MoneyPuck's Expected Goals Percentage (xG%)
2. The Line Blender: Embedding Line Performance Using a GNN
3. The Line Blender: Using a GNN To Produce Olympic Rosters
4. The Line Blender: Using GNN Embeddings for Player Rankings
5. The Line Blender: Olympic Lineups with Announced Rosters
6. The Line Blender: Hypothetical Russian Olympic Lineups
-
Credit to MoneyPuck lines/pairs and skaters data used in this series. ↩
-
NHL Edge data was included in the training data, collected using the nhl-api-py library. ↩
-
All images produced using PuckPedia's PuckGM tool. ↩